Alex Nazarovsky

MATLAB, DSP, Julia, Power quality, Engineering, Metrology

Drawing Horizontal and Vertical Lines in MATLAB Plot

Often we need to draw a vertical or horizontal line across the plot, to mark the boundaries or min/max value of the function. It’s not obvious at the first glance how to do it, becase the X and Y limits can be different, and also we need to handle zoom commands. I’m now using the solution, based on graph2d.constantline which was found here

Drawing horizontal and vertical lines in MATLAB plot
1
2
3
4
5
6
7
   GRAPH_COLOR=[.7 .7 .7];
   hx = graph2d.constantline(t_start, 'LineStyle',':', 'LineWidth',2, 'Color',GRAPH_COLOR);
   changedependvar(hx,'x');
   hx = graph2d.constantline(t_start+duration, 'LineStyle',':','LineWidth',2, 'Color',GRAPH_COLOR);
   changedependvar(hx,'x');
   hy = graph2d.constantline(magnitude, 'LineStyle',':','LineWidth',2, 'Color',GRAPH_COLOR);
   changedependvar(hy,'y');

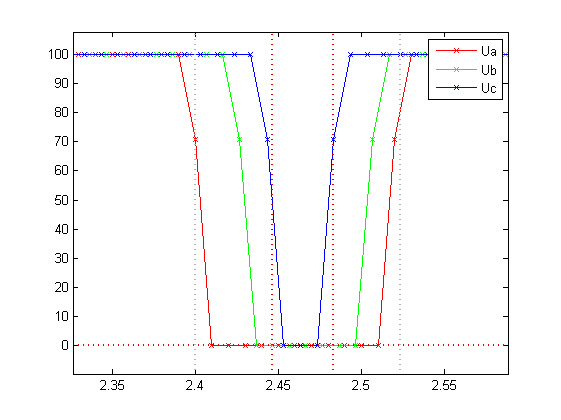
It looks like this, and it also correctly handles zoom in and out commands.

UPD 03.04.2015 Unfortunately this does not work in Matlab 2014b or higher. Try this solution .